
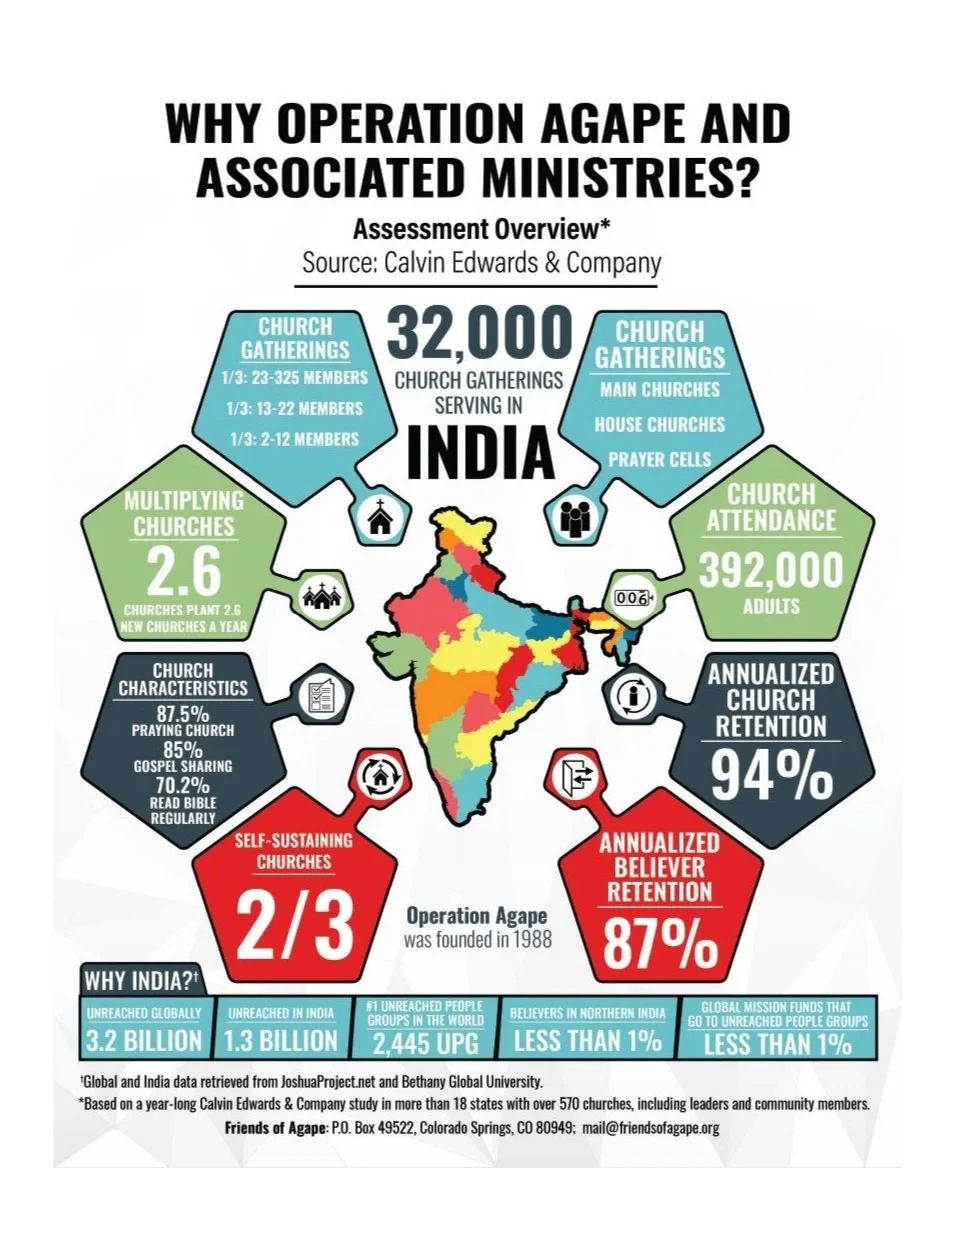
Making Ministry Impact Clear
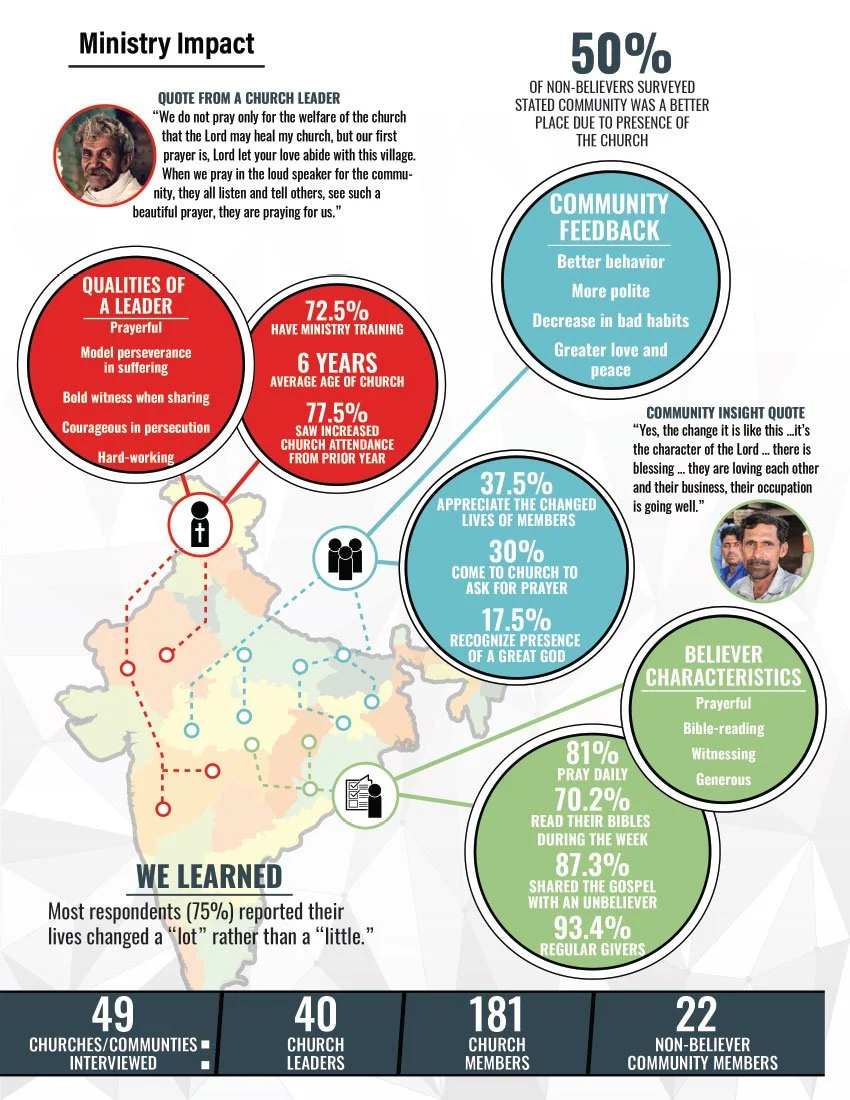
I designed this foldout infographic for Friends of Agape, translating an independent assessment of Operation Agape’s work in India into a visual story for donors. Maps, icons, and prominent statistics connect program reach, leadership training, and community impact. Leadership reported that the piece supported increased donations; specific fundraising figures were not available.
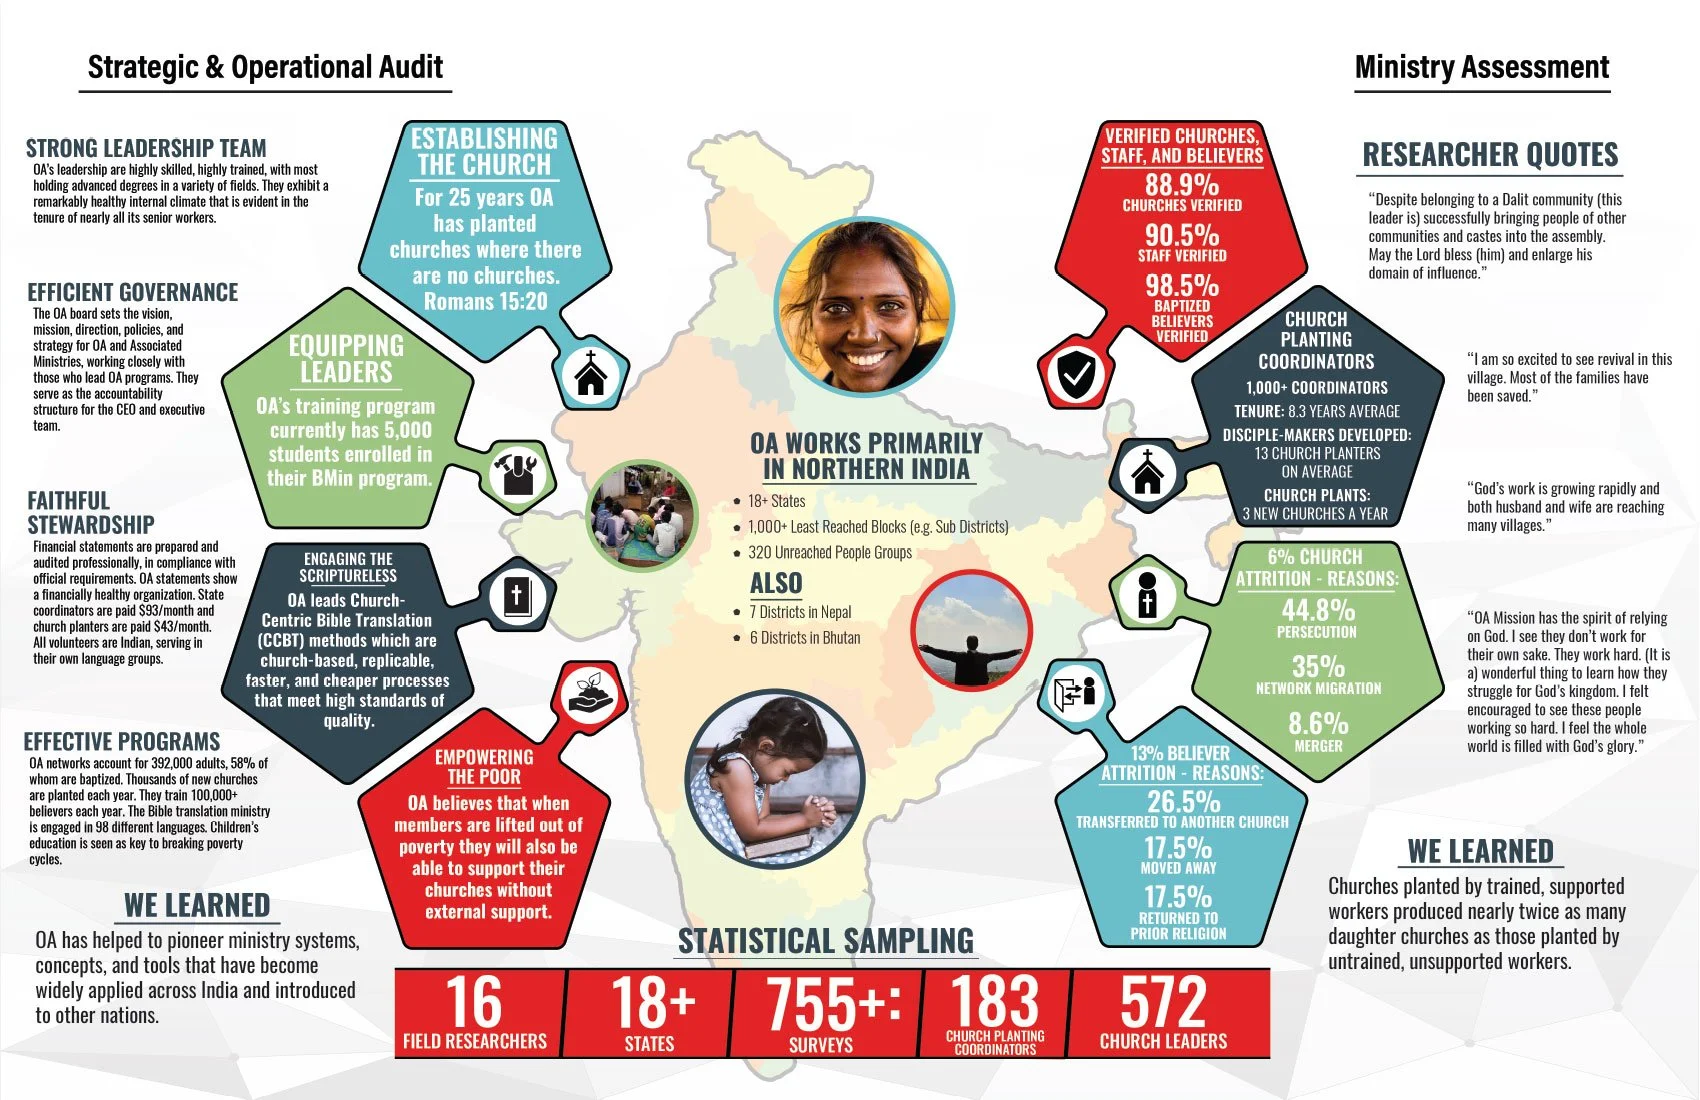
Turning Complex Data Into a Clear Story
I developed the color palette, visual concepts, and layout, shaping a large collection of research findings and statistics into a cohesive visual identity. Consistent colors, icons, and information hierarchy guide readers through the organization’s work, connecting individual findings to a clear message about the need, the impact, and the value of donor support.